Reports
The Reports tab shows where your money went and how spending is trending.
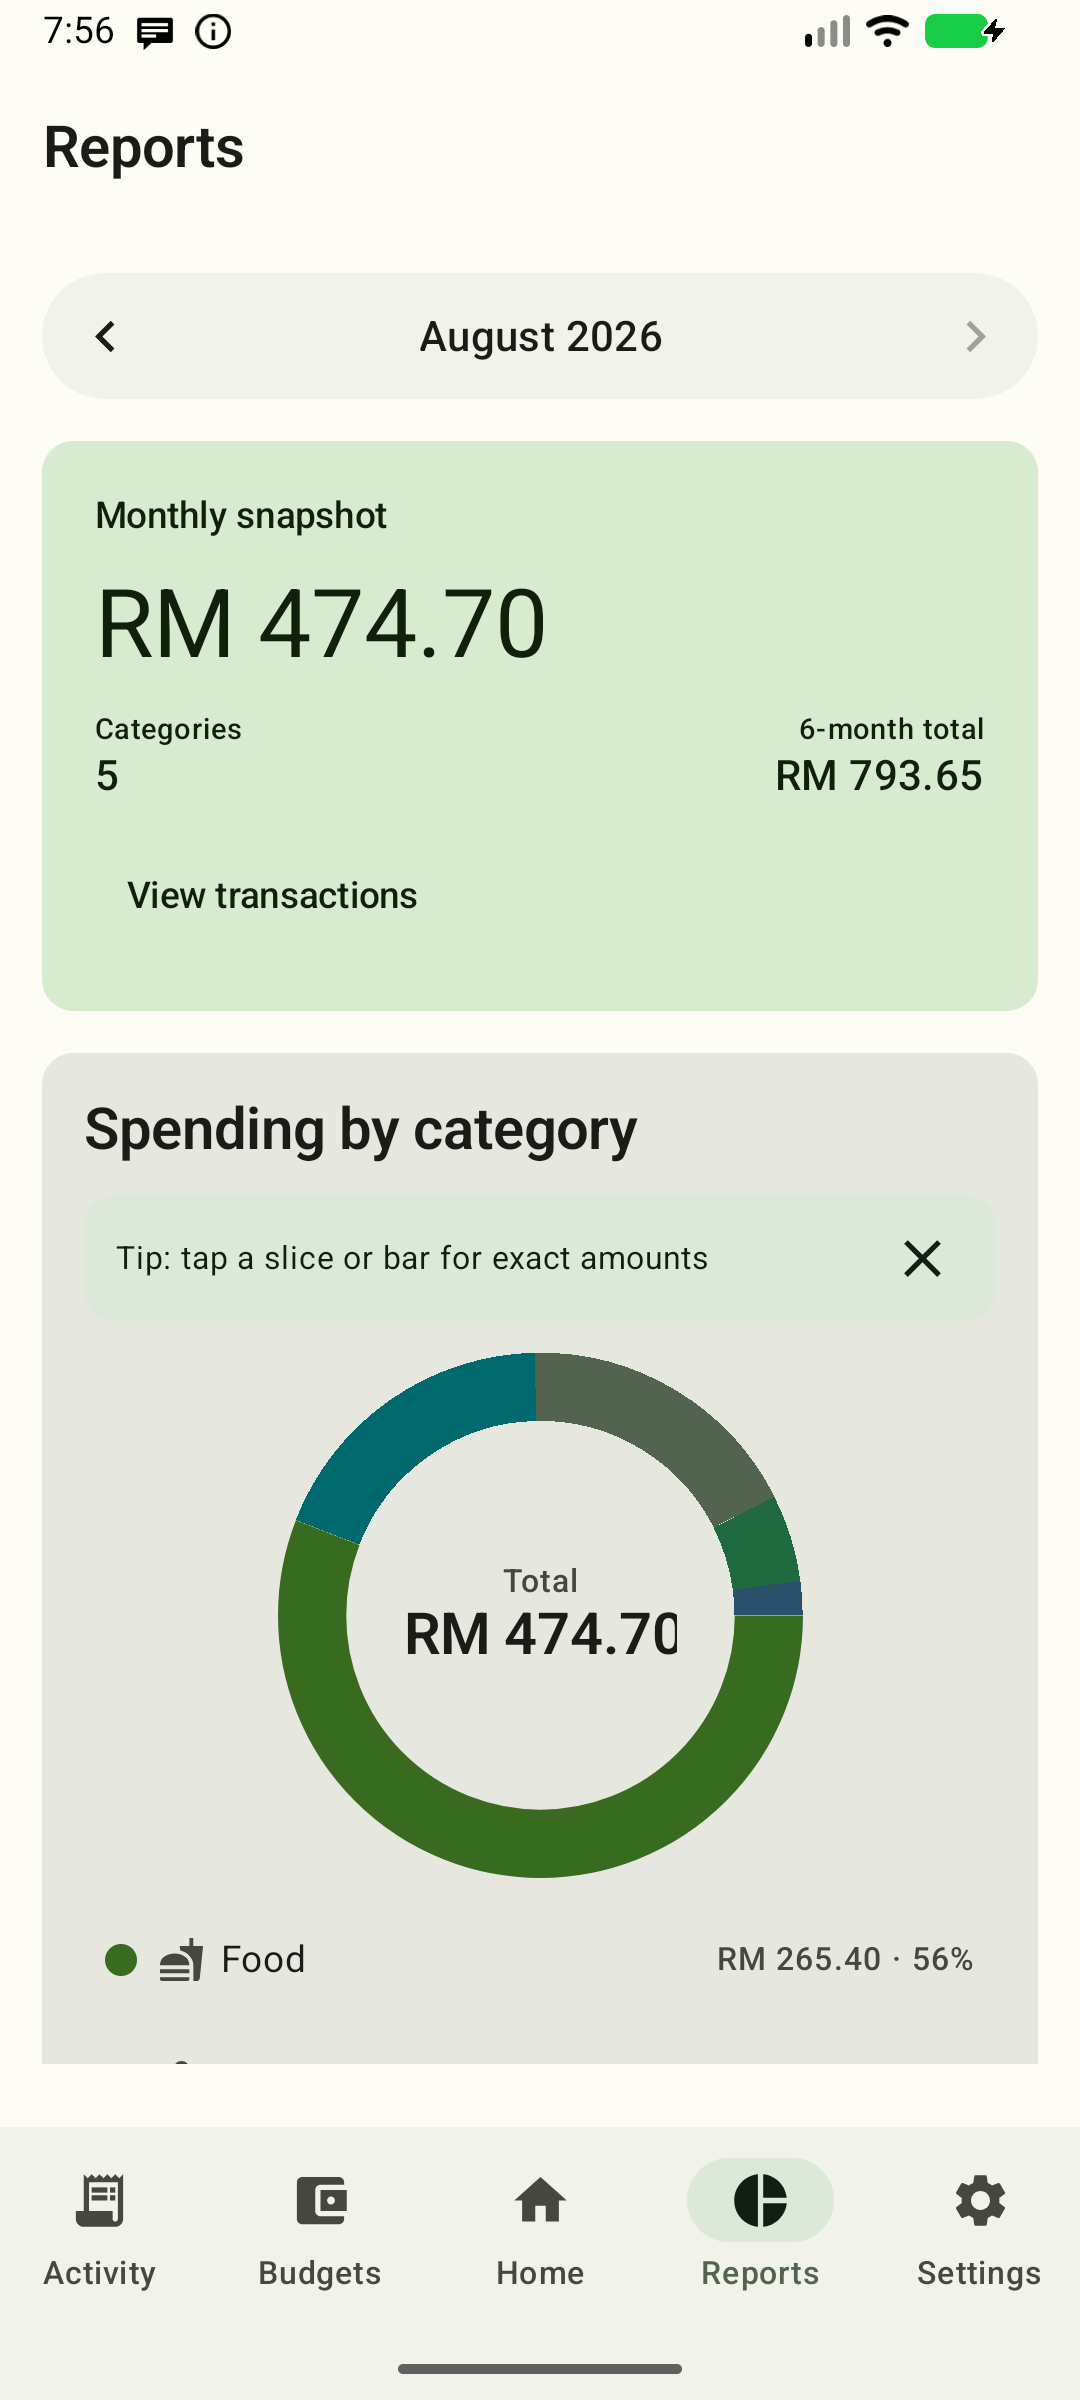
Monthly snapshot
- Total spent this month.
- Categories — count of categories with spending.
- 6-month total — completed expenses across the trend window (the viewed month and the five before it).
- View transactions — opens the Activity tab pre-filtered to the month you are viewing.
Spending by category (donut)
An animated donut chart splits the month's completed expenses by category. Each slice is a category (legend below: color dot, icon, name, amount, percent) and the total sits in the donut hole.
- Tap a slice to see its exact value and share in a small tooltip; tap anywhere else on the chart to close it. Tooltips also close themselves after 4 seconds. The whole ring is tappable — even hairline slices select on the first tap — and the selected slice gets a brighter fill.
- Legend rows are tappable too: tap one to select that slice (the row highlights while it is selected). Tap again to clear.
- With a slice selected, View transactions appears next to the chart title and opens the Activity tab filtered to that category and month.
- Slices under 2% of the total are merged into a single Other row so tiny wedges stay readable; legend and totals always agree with the snapshot.
- Slices under 1% of the total show as
<1%rather than a round0%. - Colors come from your theme's accent colors, tuned for contrast against the card in both light and dark mode — no category ever shows in "error" red.
- Uncategorized transactions show as Uncategorised.
- A one-time tip ("tap a slice or bar for exact amounts") appears above the chart until you dismiss it.
6-month trend (bars)
An animated column chart of total completed expenses per month for the
current month and the previous five, with gridlines and a compact value scale
(RM 5k, RM 10k). The current month's bar is highlighted. Tap a bar to
see its exact value in a small tooltip (tooltips auto-close after 4 seconds).
Months with small spending still show a visible bar sliver instead of
disappearing next to a much larger month.
Month selector
Use ‹ / › to change the month — the snapshot and donut update; the trend
always shows that month and the five before it. The › arrow is disabled at
the current month; when viewing a past month, a Today button appears to
jump straight back.
On Reports you can also tap the month label itself (e.g. "August 2026") to open a year/month picker: step between years with the arrows and tap a month to jump straight there — handy for reaching old months without repeated taps.
Months after the current one show "No data for \<Month> yet" instead of the usual capture hint, since nothing can be captured there yet.
When spending is hidden
If your base currency has no exchange rates set, foreign-currency spending cannot be converted and would show as nothing. A warning card appears on the Reports tab pointing you to Settings → General → Exchange rates. Otherwise a footnote appears when only some rows were unconvertible.
What counts?
Reports show only completed expenses. Hidden transactions are excluded too (they're not visible by default).